

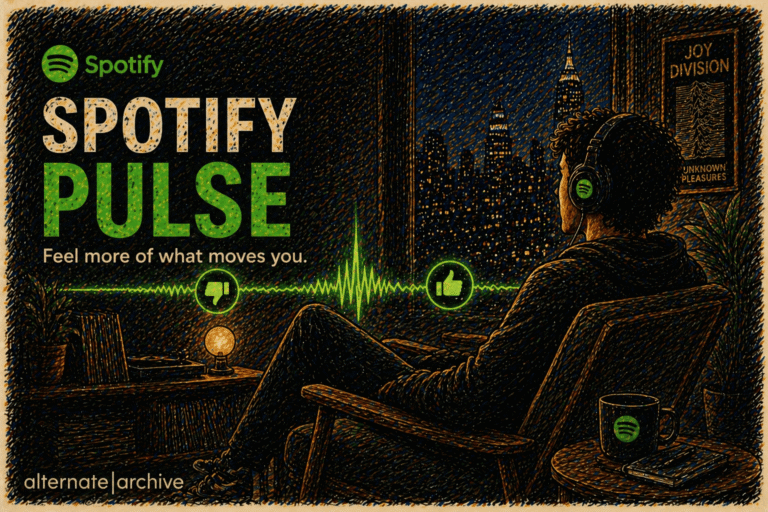
A concept document. The idea is fictional. The problem it solves is real.
The first music chart was published by Billboard in 1936. It ranked songs by sheet music sales. Not by how many people had heard them. Not by how many people had felt something when they did. By how many people had walked into a store and bought the paper version.
The metric changed over the following 90 years as the formats did. Jukebox plays. Radio spins. Record sales. Downloads. Streams. Each version counted a behaviour that was one step removed from the experience it was trying to describe. The chart had always been a proxy.
Spotify launched Wrapped in 2016 as an annual summary of what each user had listened to. It became one of the most shared social media events on the internet, not because the data was surprising but because it was recognisable. It told people something about themselves they already suspected and gave them a reason to say it out loud.
The question the product team had been sitting with since late 2024 was what a real-time version of that looked like. Not what you listened to last year. What the room is feeling right now.
By Q1 2025 Spotify had accumulated more than 15 years of listening data across 600 million users in 180 markets. The platform knew which songs people played at 2am, which they added to playlists with names that suggested they were either falling in love or had recently stopped, and which they had skipped after eleven seconds for three years running before suddenly listening to in full. The data was behavioural. It described what people did with music. It did not describe what music did to them.
The distinction matters more than it appears to.
Research has found that people who experience physical chills while listening to music have a higher density of neural fibres connecting their auditory cortex to the areas of the brain associated with emotional processing. Not more sensitive people in a general sense. People whose brains are more structurally wired to music than average. Estimates suggest this applies to roughly a third of the population. Spotify had approximately 200 million of them and no mechanism for asking how they felt on a given Tuesday.
Pulse was built to ask.
The mechanic was simple. A user opened a dedicated tab and saw a live chart of the 100 most actively moving tracks at that moment. Each carried a score that moved in real time based on incoming votes. A listener could vote a track up or down once per hour. The chart updated every 60 seconds.
The first version ranked tracks by net positive votes. It produced a chart that looked like a marginally faster version of the existing editorial charts. Familiar songs. Minor positional shuffling. The team switched to a volatility model. A track that half the room loved and half actively rejected ranked higher than one that everyone felt neutrally about. The chart became a map of songs that made people feel something strong enough to respond to, in either direction. The team called this the disagreement premium internally and did not use the phrase in any external communication.
The data revealed how fast collective emotion moves. Within three weeks the team had identified consistent patterns across the day. Morning sessions were dominated by high-tempo tracks in major keys. The chart between midnight and two showed a pronounced shift toward slower tempos and minor keys.
What was not expected was the sensitivity to external events. A significant football result in a given market registered in the Pulse chart within 11 minutes. Not because listeners were consciously voting on football songs. Because the emotional state produced by the result changed how they responded to everything they heard in the following hour. A city that had just won something voted differently than a city that had just lost, across every genre, every track simultaneously.
Pulse was not measuring what people thought about songs. It was measuring what was happening to people while they were listening.
By Q2 2025 the data had identified a class of tracks that entered the chart and became its most actively moving assets within hours. Not promoted. They surfaced because a critical mass of listeners had voted on them in strongly opposing directions within a short window. Pulse had become a discovery mechanism for songs that divided people before the broader platform knew they existed.
By Q3 2025, junior staff at three major labels had been assigned to monitor Pulse’s volatility leaders as part of their weekly scouting process. This was not a partnership. They were reading the public chart the same way an analyst reads an earnings release. Artist Relations was informed. No action was taken.
Three Pulse-originated tracks received major label deals in the second half of 2025. Combined advances of $4.2 million. Spotify was not party to any of those transactions. Artist Relations had prepared a formal proposal on that point. Legal had reviewed it.
December 2025 Wrapped included, for Pulse participants, a secondary report showing their personal voting history across the year. The tracks they had driven up. The tracks they had pushed down. The moments when their votes had moved against the majority of the room. The data science team noted that Pulse voting patterns predicted personality dimensions at a higher rate than listening history alone.
This finding has not been published. Other concerns apply.
The 2am chart had 4.1 million daily active users by end of year. No editorial curation. No algorithmic promotion. Entirely the product of people being awake at that hour and voting on how songs make them feel in the dark.
What Pulse built, without intending to, was a room. Not a playlist, not a chart, not a recommendation engine. A place where strangers gathered at the same hour and responded to the same songs and produced, collectively, something none of them could have produced alone. The midnight chart was not curated by Spotify. It was curated by everyone awake at midnight, voting on what the night felt like.
Music has always been communal. The chart had spent 90 years making it competitive. Pulse made it shared again.
Other concerns apply.
Sources
Pulse, the voting system, all programme data, and associated outcomes are invented. All facts below are real.
Billboard first chart. Billboard Magazine published its first music popularity chart in January 1936, ranking songs by sheet music sales. [Billboard, company history.]
Spotify Wrapped. Launched as “Year in Music” in 2015, rebranded as Wrapped in 2016. [Spotify, newsroom.]
Spotify scale. Approximately 600 million monthly active users across 180 markets as of early 2025. [Spotify AB, earnings reports 2024.]
Musical frisson. Research by Matthew Sachs et al. found structural differences in neural connectivity in people who experience chills when listening to music, estimated to apply to approximately a third of the general population. [Sachs et al., Social Cognitive and Affective Neuroscience, 2017.]